Plot a dataframe, one y against multiple xs
dfplot2(x, y, xlab = "x", ylab = "y", xlim = NULL, ylim = NULL, mycol = NULL,
    mylty = NULL, xerror = NULL, yerror = NULL, mycolerrorbar = NULL, mylegend = NULL)
Arguments
| x | a vector or a dataframe with the same length as x |
|---|---|
| y | a vector |
| xlab | character |
| ylab | character |
| xlim | numeric |
| ylim | numeric |
| mycol | colours |
| mylty | numeric |
| xerror | errorbar, same dimension of x |
| yerror | same dimension of y |
| mycolerrorbar | error bar colours |
| mylegend | character |
Value
a figure
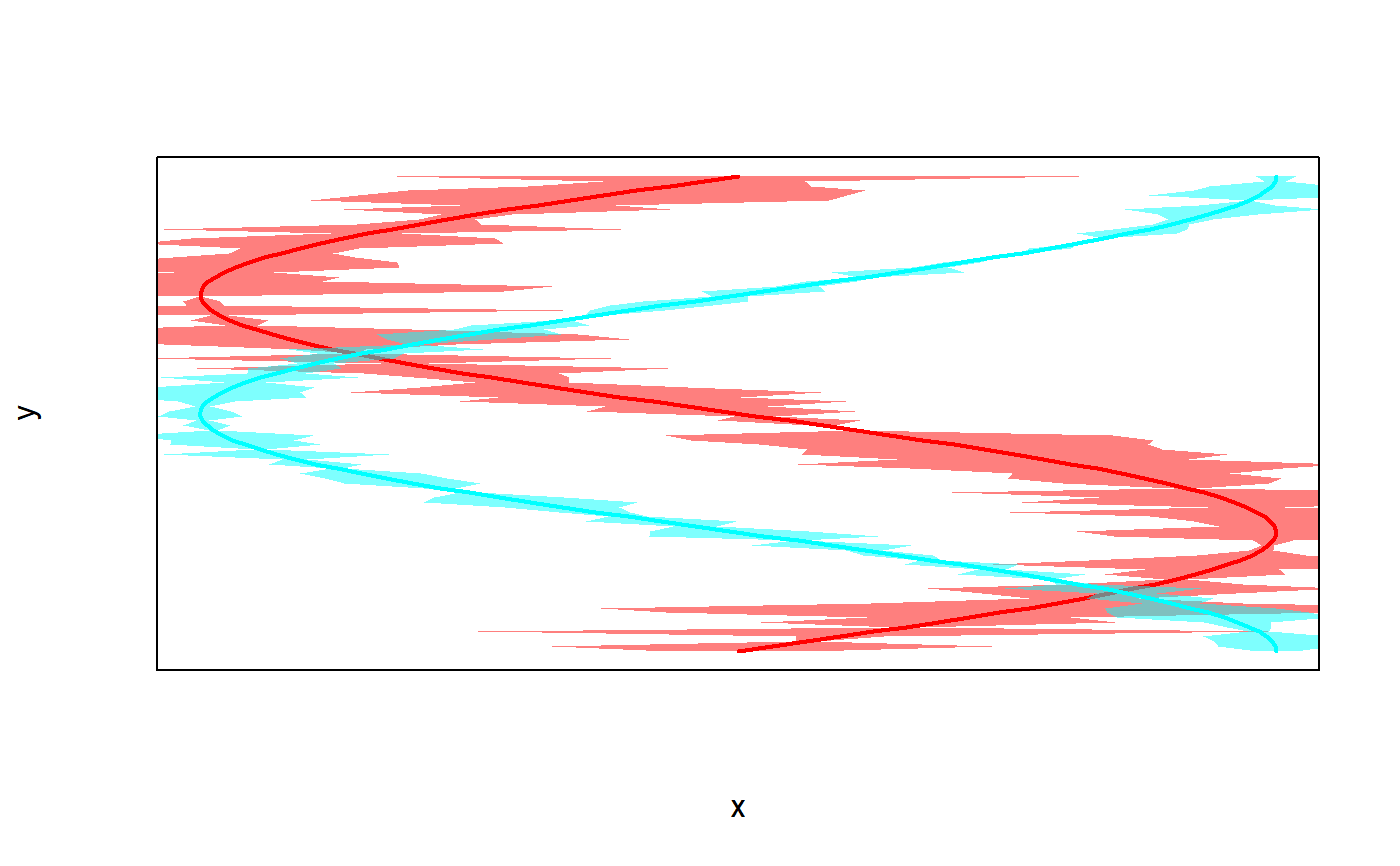
Examples
x <- seq(0, 2 * pi, length.out = 100)
y <- data.frame(sin(x), cos(x))
yerror <- data.frame(abs(rnorm(100, sd = 0.3)), abs(rnorm(100, sd = 0.1)))
dfplot2(y, x, xerror = yerror)